工具链部署实用技巧 7|模型设计帧率推理时耗时与带宽分析
 加入技术交流群
一、前言
对 hrt_model_exec 工具进行修改,让它能让单个模型按设计帧率运行指定的帧数,还能计算每帧推理耗时和系统时间戳;
运行修改后的 hrt_model_exec 工具和系统软件里的带宽检测工具 hrut_ddr,分析日志,查看模型耗时和带宽的变化情况。
通过示例说明工具的使用和数据分析方法。
二、 hrt_model_exec 魔改方法
通过–perf_fps 实现模型在单核单线程下按照设计帧率运行;
通过–frame_count 控制按照设计帧率推理的总帧数;
log 中输出系统时间戳、当前推理帧数,推理 Latency。
2.1 代码修改
2.1.1 main.cpp
//在代码开头增加perf_fps参数,
DEFINE_int32(perf_fps, 99999999, "run at the set FPS");
//在static int32_t parsing_gflags()函数中增加
flagsparase.FLAGS_perf_fps = FLAGS_perf_fps;
2.1.2 parse_util.h
int32_t FLAGS_perf_fps{0};2.1.3 log_util.cpp
void print_usage() {
  std::stringstream ss;
  .....
  ss << "[Examples]" << std::endl;
  ss << "---------------------------------------------------------------"
        "------------------------------------------------"
     << std::endl;
  .....
  ss << std::setw(2) << "|" << std::setw(3) << " " << std::setw(32)
     << "--dequantize_process";
  //在这里增加代码,注意增加代码的位置,不然log中打印会错乱
  ss << std::setw(2) << "|" << std::setw(3) << " " << std::setw(32)
     << "--perf_fps";
  ss << std::endl;
  ss << std::setw(3) << " " << std::setw(32) << " ";
  .....
  std::cout << ss.str();
}
2.1.4 function_util.cpp(重点)
int32_t model_performance(hbDNNPackedHandle_t packed_dnn_handle,
                          FLAGSParase flagsparase) {
  // 获取模型名称
  const char **model_name_list;
  int32_t model_count = 0;
  HB_CHECK_SUCCESS(
      hbDNNGetModelNameList(&model_name_list, &model_count, packed_dnn_handle),
      "hbDNNGetModelNameList failed");

  if (flagsparase.FLAGS_model_name.empty()) {
    if (model_count == 1) {
      flagsparase.FLAGS_model_name = model_name_list[0];
    } else {
      LOGE("Multiple models found. Please set --model_name.");
      return -1;
    }
  }

  // 获取模型 handle
  hbDNNHandle_t dnn_handle;
  HB_CHECK_SUCCESS(hbDNNGetModelHandle(&dnn_handle, packed_dnn_handle,
                                       flagsparase.FLAGS_model_name.c_str()),
                   "hbDNNGetModelHandle failed");

  // 判断是否为单线程 + perf_fps 场景
  if (flagsparase.FLAGS_thread_num == 1 && flagsparase.FLAGS_perf_fps > 0) {
    // 执行单线程、定帧率推理
    int32_t input_count = 0;
    int32_t output_count = 0;
    int32_t frame_count = flagsparase.FLAGS_frame_count;
    float target_fps = flagsparase.FLAGS_perf_fps;
    float frame_interval_us = 1e6 / target_fps;

    HB_CHECK_SUCCESS(hbDNNGetInputCount(&input_count, dnn_handle),
                     "hbDNNGetInputCount failed");
    HB_CHECK_SUCCESS(hbDNNGetOutputCount(&output_count, dnn_handle),
                     "hbDNNGetOutputCount failed");

    hbDNNTensor *input_tensor = new hbDNNTensor[input_count];
    hbDNNTensor *output_tensor = new hbDNNTensor[output_count];

    HB_CHECK_SUCCESS(
        prepare_input_tensor(input_tensor, dnn_handle, input_count, flagsparase),
        "prepare_input_tensor failed");
    HB_CHECK_SUCCESS(
        prepare_output_tensor(output_tensor, dnn_handle, output_count),
        "prepare_output_tensor failed");

    for (int frame_id = 0; frame_id < frame_count; ++frame_id) {
      uint64_t start_us = CurrentTs();

      hbUCPTaskHandle_t task_handle = nullptr;
      HB_CHECK_SUCCESS(
          hbDNNInferV2(&task_handle, output_tensor, input_tensor, dnn_handle),
          "hbDNNInferV2 failed");

      hbUCPSchedParam sched_param{};
      HB_UCP_INITIALIZE_SCHED_PARAM(&sched_param);
      sched_param.backend = flagsparase.FLAGS_core_mask;
      sched_param.priority = flagsparase.FLAGS_task_priority;

      HB_CHECK_SUCCESS(hbUCPSubmitTask(task_handle, &sched_param),
                       "hbUCPSubmitTask failed");
      HB_CHECK_SUCCESS(hbUCPWaitTaskDone(task_handle,
                                         flagsparase.FLAGS_task_timeout),
                       "hbUCPWaitTaskDone failed");

      uint64_t end_us = CurrentTs();
      float latency_ms = (end_us - start_us) / 1000.0f;
      // std::cout << "[Frame " << frame_id << "] latency = "
      //           << std::fixed << std::setprecision(3)
      //           << latency_ms << " ms" << std::endl;
      // 获取当前系统时间字符串
      auto now = std::chrono::system_clock::now();
      auto in_time_t = std::chrono::system_clock::to_time_t(now);
      auto ms = std::chrono::duration_cast<std::chrono::milliseconds>(
                    now.time_since_epoch()) %
                1000;

      std::stringstream timestamp_ss;
      timestamp_ss << "[" << std::put_time(std::localtime(&in_time_t), "%F %T")
                  << "." << std::setfill('0') << std::setw(3) << ms.count() << "] ";
      //输出系统时间,frame_id 和推理Latency
      std::cout << timestamp_ss.str()
                << "[Frame " << frame_id << "] latency = "
                << std::fixed << std::setprecision(3)
                << latency_ms << " ms" << std::endl;

      HB_CHECK_SUCCESS(hbUCPReleaseTask(task_handle),
                       "hbUCPReleaseTask failed");

      uint64_t used_us = end_us - start_us;
      if (used_us < frame_interval_us) {
        usleep(static_cast<useconds_t>(frame_interval_us - used_us));
      }
    }

    // 清理内存
    for (int i = 0; i < input_count; ++i) {
      release_tensor(&input_tensor[i]);
    }
    for (int i = 0; i < output_count; ++i) {
      release_tensor(&output_tensor[i]);
    }
    delete[] input_tensor;
    delete[] output_tensor;
  } else {
    // 多线程推理走原逻辑
    run_model_with_multi_thread(dnn_handle, flagsparase.FLAGS_thread_num,
                                flagsparase.FLAGS_frame_count, flagsparase);
  }

  return 0;
}cd samples/ucp_tutorial/tools/hrt_model_exec/ bash build_aarch64.sh
├── aarch64
│   ├── bin
│   │   └── hrt_model_exec #执行程序
│   └── lib #依赖库
│       ├── libdnn.so
│       ├── libhb_arm_rpc.so
│       ├── libhbrt4.so
│       ├── libhbtl_ext_dnn.so
│       ├── libhbtl.so
│       ├── libhbucp.so
│       ├── libhlog_wrapper.so
│       └── libperfetto_sdk.so
└── script
    └── run_hrt_model_exec.sh #执行脚本
2.2 参考命令
#设计帧率20FPS的模型在core 0上单线程运行2000帧
hrt_model_exec perf --model_file model.hbm --perf_fps 20 --frame_count 2000 --core_id 0 2>&1 |tee ./infer.log
[2025-04-03 09:36:05.486] [Frame 0] latency = 22.915 ms
[2025-04-03 09:36:05.586] [Frame 1] latency = 22.495 ms
[2025-04-03 09:36:05.686] [Frame 2] latency = 22.488 ms
[2025-04-03 09:36:05.787] [Frame 3] latency = 22.515 ms
[2025-04-03 09:36:05.887] [Frame 4] latency = 22.496 ms
[2025-04-03 09:36:05.987] [Frame 5] latency = 22.658 ms
[2025-04-03 09:36:06.087] [Frame 6] latency = 22.607 ms
.....
三、hrut_ddr 带宽监测工具
Usage: hrut_ddr [OPTION]...
Show and calculate memory throughput through AIX bus in each period.

Mandatory arguments to long options are mandatory for short options too.
   -t, --type     The type of monitoring range.    Supported
                  values for type are(case-insensitive)
                  when multiple type specified, Enclose in quotation marks
                  e.g. -t "mcu cpu"
                  If the types exceeds 1, a RoundRobin method is used.
                       For accuracy, set as less types as possible
                  e.g. In the first period the mcu data is read, second period the cpu data is read.
                  The elapsed time get averaged, and each type result in one round put into one table
                     all  vdo  cam  cpe0  cpe1  cpe2  cpe3  cpelite
                   gpu  vdsp  peri  his  sram  bpu  mcu  cpu
                   secland
                  cpu        only monitor the throughput of CPU master range
                  bpu        only monitor the throughput of BPU master range
                  cam        only monitor the throughput of Camera master range
                  all        monitor the throughput of all range types (default)
                  rr_all     RoundRobin between all range types
   -p, --period   The sample period for monitored range. (unit: us, default: 1000, range:[1000, 2000000])
   -d, --device   The char device of DDR Perf Monitor. [0~5] 0: ddrsys0 mon0, 2 ddrsys1_mon0
                    all (default)
   -n, --number   The sampling period times for monitored range before copying to userspace. (0~400] default: 100
                  !!!When in roundrobin mode, this is forcely set to 1
   -N, --over_all Over_all read times. i.e. Approximately how much tables you get in commands line
   -f, --filename the csv output filename
   -r, --raw      Output raw data, hexadecimal format, without conversion. Decimal by default
   -c, --csv      Output csv format data
   -D, --dissh    Disable shell output


J6P SOC, of 8 DDR systems, 2 monitors each SYS, 1 ports each monitor
Example:
hrut_ddr -t all -p 1000 -d 0
hrut_ddr -t all -p 1000 -r
hrut_ddr -t cpu -p 1000
hrut_ddr -t "cpu mcu" -p 1000 -f "mon0.csv"
hrut_ddr -d "0 1" -p 1000
四、示例说明
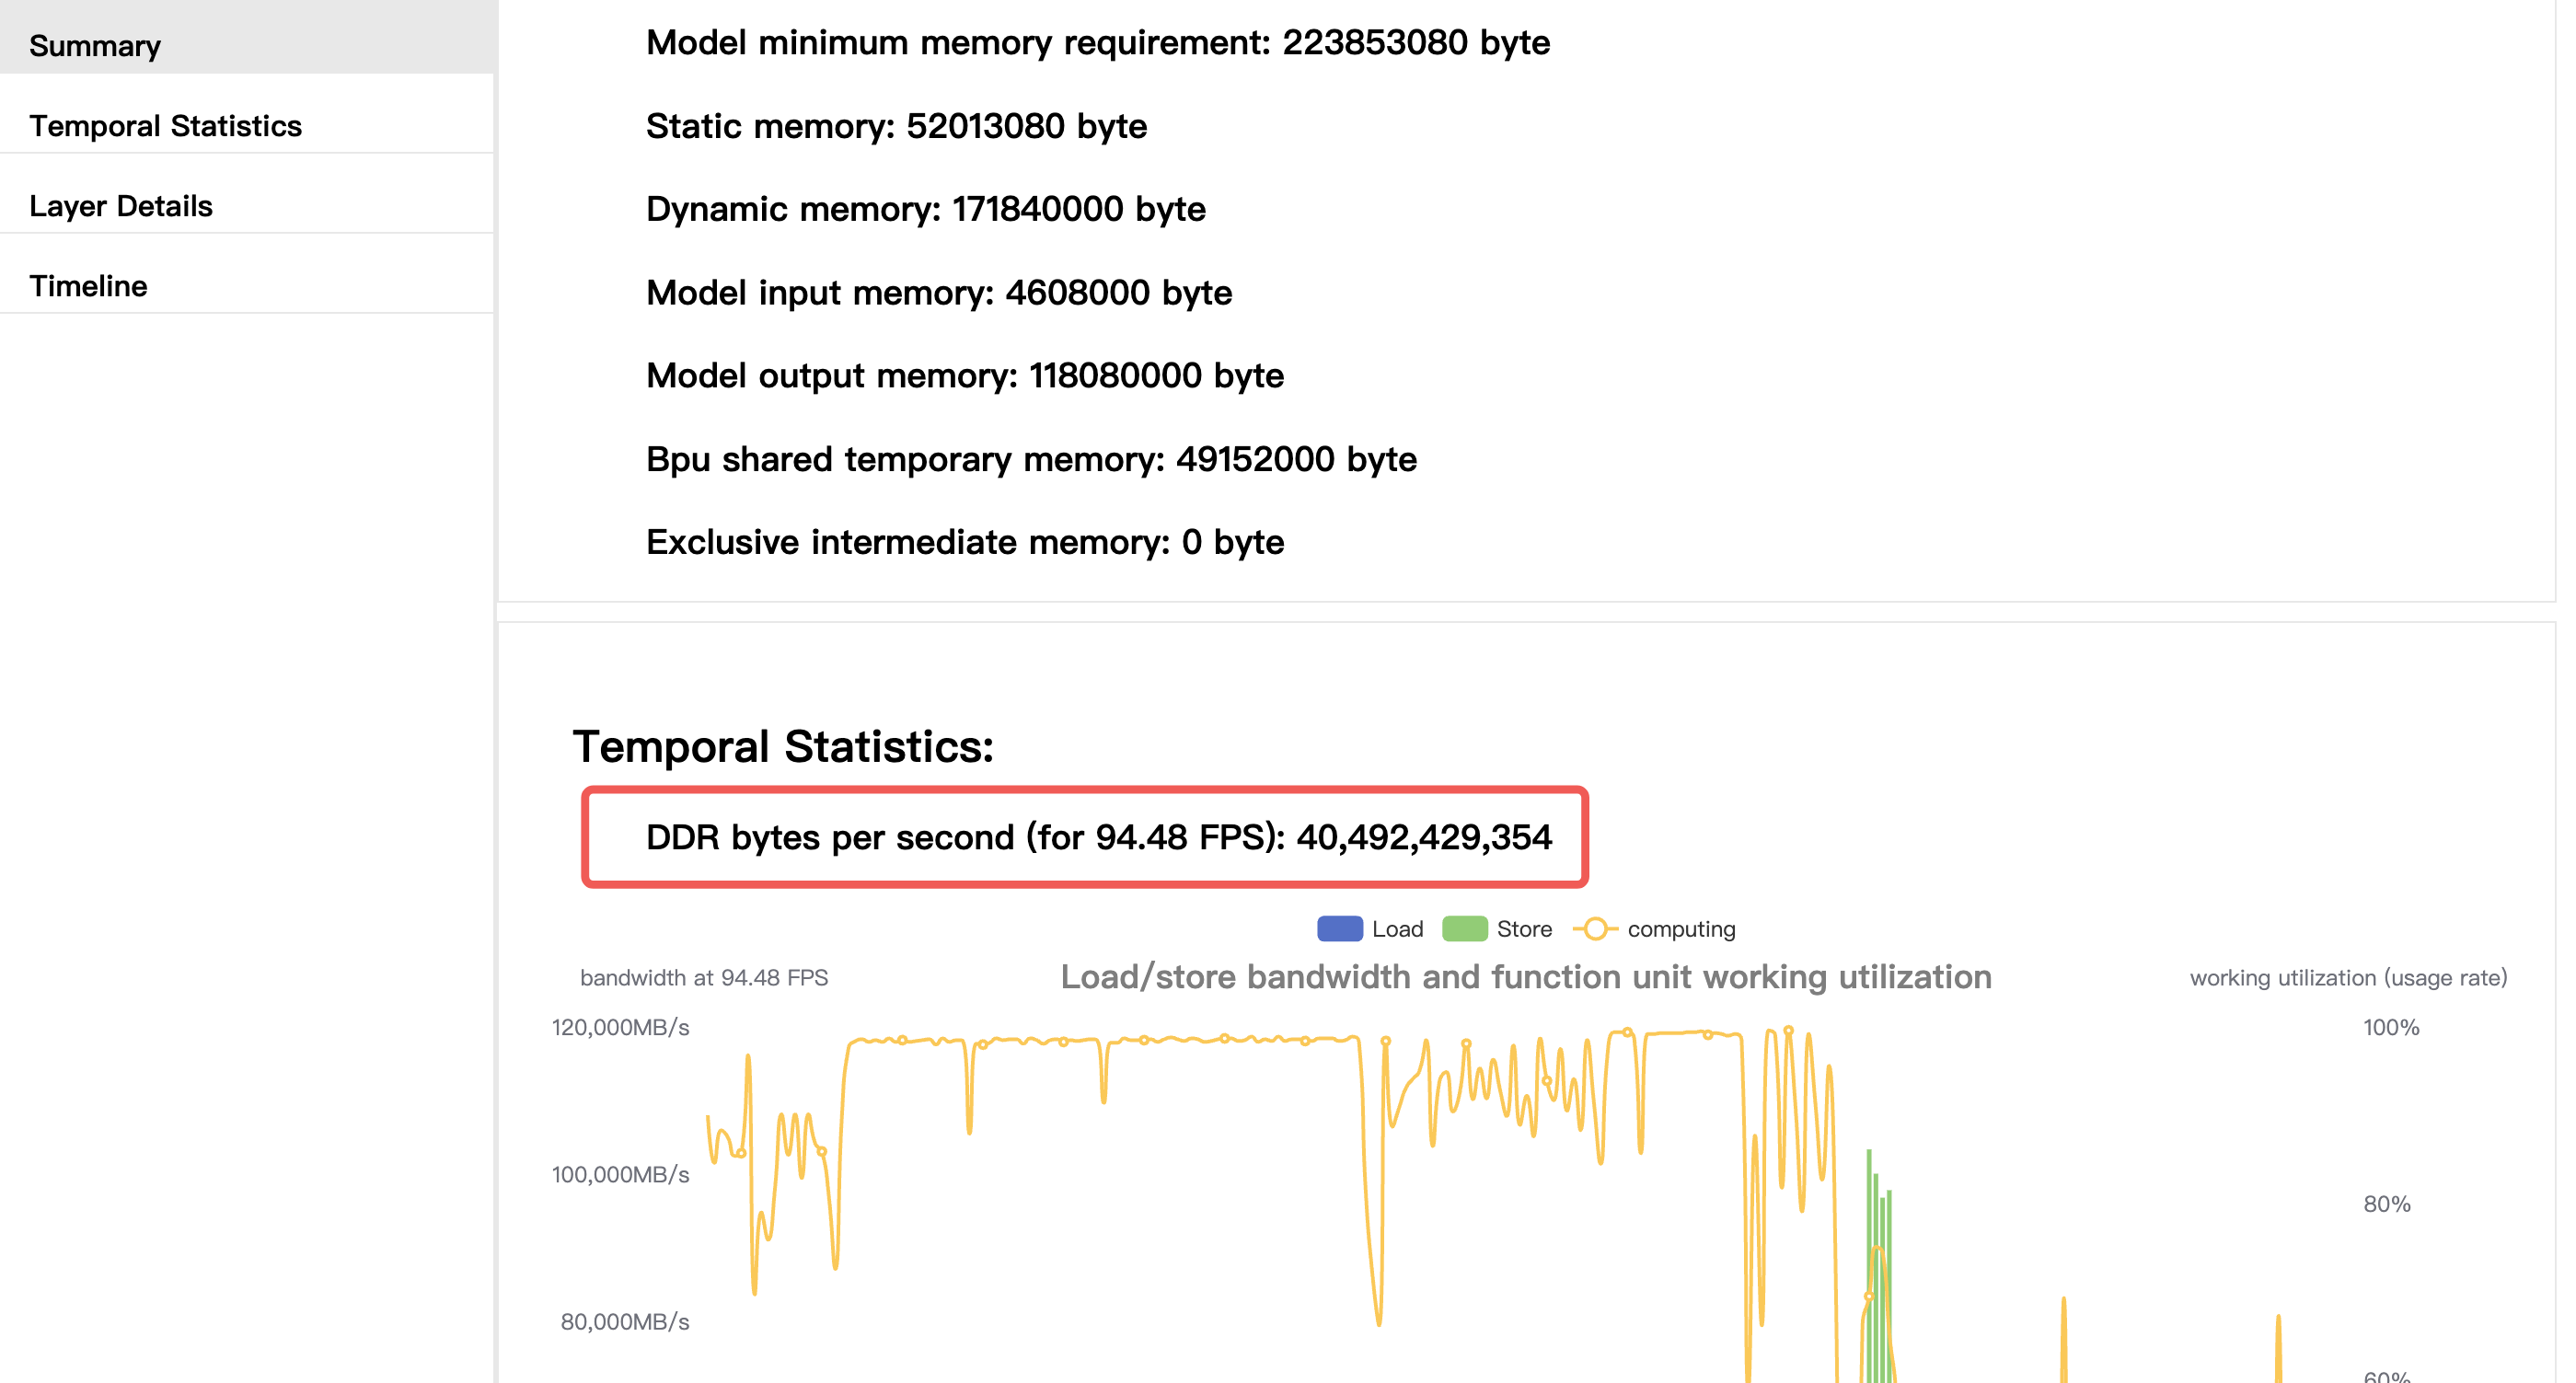
4.1 步骤 1 选取模型
4.2 步骤 2 模型推理和带宽监测
./hrut_ddr -t bpu 2>&1 |tee ./hrut_tool.log
hrt_model_exec perf --model_file model1.hbm --perf_fps 20 --frame_count 20000  2>&1 |tee ./model1.log
hrt_model_exec perf --model_file model2.hbm --perf_fps 10 --frame_count 10000  2>&1 |tee ./model2.log
hrt_model_exec perf --model_file model3.hbm --perf_fps 20 --frame_count 20000  2>&1 |tee ./model3.log
hrt_model_exec perf --model_file model4.hbm --perf_fps 10 --frame_count 10000  2>&1 |tee ./model4.log
4.5 步骤 3 数据分析
耗时带宽总体趋势图
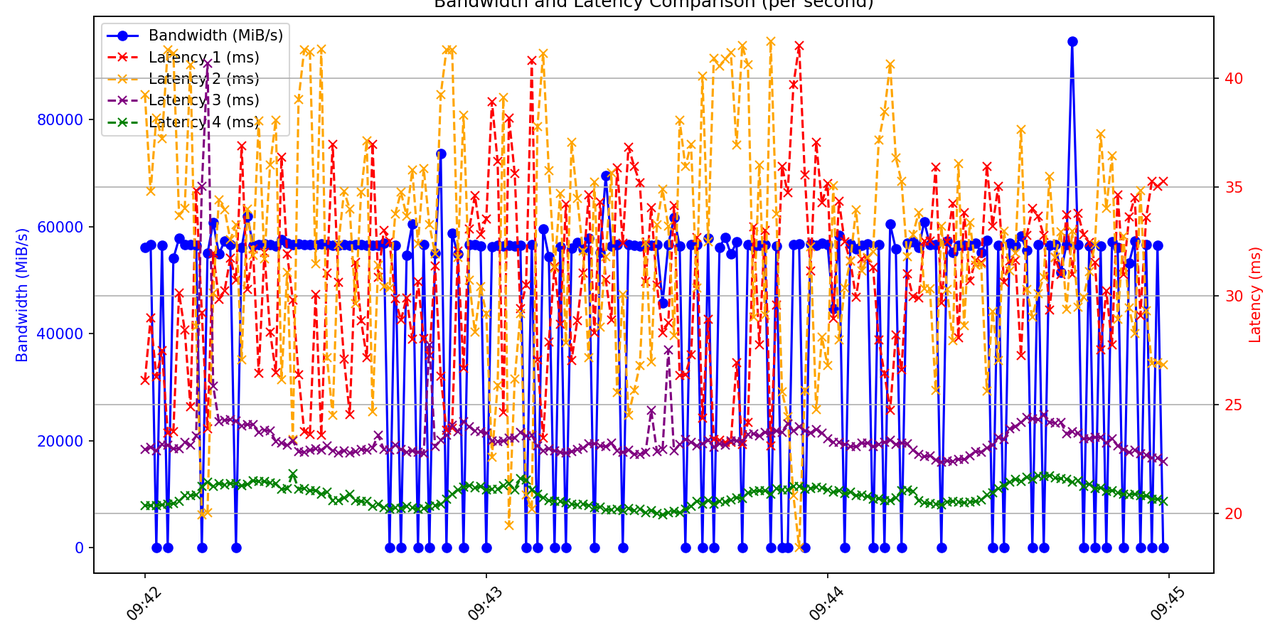
指定绘图的时间段,hrut_ddr 和 hrt_model_exec 均有系统时间戳;
计算每秒钟的平均耗时和带宽占用;
将多个模型的耗时和带宽集成在同一张图上。
import re
import csv
from datetime import datetime
from collections import defaultdict
import matplotlib.pyplot as plt
import matplotlib.dates as mdates

# === 配置 ===
bandwidth_log_file =  'hrut_tool.log'
latency_log_files = ['model1.log', 'model2.log', 'model3.log', 'model4.log']
csv_file = 'performance_per_second.csv'
plot_file = 'multi_latency_bandwidth_trend.png'

# 可选时间范围
time_start = '2025-04-03 09:42:00'
time_end = '2025-04-03 09:45:00'
dt_start = datetime.strptime(time_start, '%Y-%m-%d %H:%M:%S')
dt_end = datetime.strptime(time_end, '%Y-%m-%d %H:%M:%S')

# 正则
time_re = re.compile(r'localtime:\s*(\d{4}-\d{2}-\d{2} \d{2}:\d{2}:\d{2})\.(\d{6})')
read_re = re.compile(r'Read\|\s*(\d+)\|\s*\d+')
write_re = re.compile(r'Write\|\s*(\d+)\|\s*\d+')
latency_re = re.compile(r'\[?(\d{4}-\d{2}-\d{2} \d{2}:\d{2}:\d{2})[.:](\d{3})\]?\s*\[Frame \d+\]\s*latency\s*=\s*([\d.]+)\s*ms')

# === 数据结构 ===
bandwidth_per_sec = defaultdict(list)
latency_per_sec_list = [defaultdict(list) for _ in latency_log_files]

# === 解析带宽日志 ===
with open(bandwidth_log_file, 'r') as f:
    lines = f.readlines()

i = 0
while i < len(lines):
    time_match = time_re.search(lines[i])
    if time_match:
        timestamp = datetime.strptime(time_match.group(1), '%Y-%m-%d %H:%M:%S')
        read = write = 0
        for j in range(i, min(i + 10, len(lines))):
            r = read_re.search(lines[j])
            w = write_re.search(lines[j])
            if r: read = int(r.group(1))
            if w: write = int(w.group(1))
        if dt_start <= timestamp < dt_end:
            key = timestamp.strftime('%Y-%m-%d %H:%M:%S')
            bandwidth_per_sec[key].append(read + write)
        i = j
    else:
        i += 1

# === 解析多个延迟日志 ===
for idx, log_file in enumerate(latency_log_files):
    with open(log_file, 'r') as f:
        for line in f:
            match = latency_re.search(line)
            if match:
                timestamp = datetime.strptime(match.group(1), '%Y-%m-%d %H:%M:%S')
                latency_val = float(match.group(3))
                if dt_start <= timestamp < dt_end:
                    key = timestamp.strftime('%Y-%m-%d %H:%M:%S')
                    latency_per_sec_list[idx][key].append(latency_val)

# === 合并数据并写 CSV ===
all_keys = set(bandwidth_per_sec.keys())
for d in latency_per_sec_list:
    all_keys |= set(d.keys())
all_keys = sorted(all_keys)

with open(csv_file, 'w', newline='') as f:
    writer = csv.writer(f)
    headers = ['time', 'avg_bandwidth'] + [f'avg_latency_{i+1}' for i in range(len(latency_log_files))]
    writer.writerow(headers)

    for key in all_keys:
        bw_avg = sum(bandwidth_per_sec[key]) / len(bandwidth_per_sec[key]) if key in bandwidth_per_sec else 0
        row = [key, round(bw_avg, 2)]
        for d in latency_per_sec_list:
            if key in d:
                lat_avg = sum(d[key]) / len(d[key])
            else:
                lat_avg = 0
            row.append(round(lat_avg, 3))
        writer.writerow(row)

print(f"✅ 写入 CSV 完成: {csv_file}")

# === 绘图 ===
times = [datetime.strptime(k, '%Y-%m-%d %H:%M:%S') for k in all_keys]
bandwidth_vals = [sum(bandwidth_per_sec[k]) / len(bandwidth_per_sec[k]) if k in bandwidth_per_sec else 0 for k in all_keys]
latency_series = []
for d in latency_per_sec_list:
    latency_vals = [sum(d[k]) / len(d[k]) if k in d else 0 for k in all_keys]
    latency_series.append(latency_vals)

fig, ax1 = plt.subplots(figsize=(12, 6))

# 左轴:带宽
ax1.plot(times, bandwidth_vals, 'b-o', label='Bandwidth (MiB/s)')
ax1.set_ylabel('Bandwidth (MiB/s)', color='b')
ax1.tick_params(axis='y', labelcolor='b')
ax1.xaxis.set_major_locator(mdates.MinuteLocator(interval=1))
ax1.xaxis.set_major_formatter(mdates.DateFormatter('%H:%M'))
plt.xticks(rotation=45)

# 右轴:多延迟曲线
ax2 = ax1.twinx()
colors = ['r', 'orange', 'purple', 'green']
for i, latency_vals in enumerate(latency_series):
    ax2.plot(times, latency_vals, marker='x', linestyle='--', color=colors[i], label=f'Latency {i+1} (ms)')
ax2.set_ylabel('Latency (ms)', color='r')
ax2.tick_params(axis='y', labelcolor='r')

# 图例
fig.tight_layout()
lines1, labels1 = ax1.get_legend_handles_labels()
lines2, labels2 = ax2.get_legend_handles_labels()
ax1.legend(lines1 + lines2, labels1 + labels2, loc='upper left')

plt.title('Bandwidth and Latency Comparison (per second)')
plt.grid(True)
plt.savefig(plot_file, dpi=150)
plt.show()

print(f"✅ 图像保存为: {plot_file}")
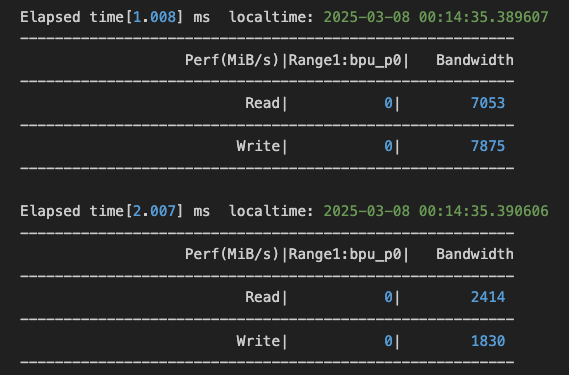
峰值带宽获取
import re

log_file = "hrut.log"  # 替换为你的日志文件路径

range_entries = []
bandwidth_entries = []

with open(log_file, "r") as f:
    lines = f.readlines()

i = 0
while i < len(lines):
    if lines[i].startswith("Elapsed time"):
        time_match = re.search(r"localtime:\s+([\d\-\s:.]+)", lines[i])
        if time_match:
            current_time = time_match.group(1).strip()
        else:
            current_time = "(unknown time)"

        range_read = range_write = None
        band_read = band_write = None

        # 预计在后面 10 行中会包含读写信息
        for j in range(i+1, i+10):
            if j >= len(lines):
                break
            line = lines[j].strip()
            if line.startswith("Read|"):
                parts = line.split("|")
                if len(parts) >= 3:
                    try:
                        range_read = int(parts[1].strip())
                        band_read = int(parts[2].strip())
                    except ValueError:
                        pass
            elif line.startswith("Write|"):
                parts = line.split("|")
                if len(parts) >= 3:
                    try:
                        range_write = int(parts[1].strip())
                        band_write = int(parts[2].strip())
                    except ValueError:
                        pass

        # 如果两个值都提取到了,则计算总和并存入对应列表
        if range_read is not None and range_write is not None:
            total = range_read + range_write
            range_entries.append((total, current_time))

        if band_read is not None and band_write is not None:
            total = band_read + band_write
            bandwidth_entries.append((total, current_time))

    i += 1

# 分别排序并打印前20项
range_entries.sort(reverse=True, key=lambda x: x[0])
bandwidth_entries.sort(reverse=True, key=lambda x: x[0])

print("前20个 Range1:bpu_p0 的 Read+Write 总和记录:")
for idx, (val, t) in enumerate(range_entries[:20], 1):
    print(f"{idx:2d}. 总和: {val}, 时间: {t}")

print("\n前20个 Bandwidth 的 Read+Write 总和记录:")
for idx, (val, t) in enumerate(bandwidth_entries[:20], 1):
print(f"{idx:2d}. 总和: {val}, 时间: {t}")专栏文章内容及配图由作者撰写发布,仅供工程师学习之用,如有侵权或者其他违规问题,请联系本站处理。 联系我们
关键词:
算法
自动驾驶
算法工具链
地平线
征程5
相关推荐
Ouster推出 Rev8 OS 激光雷达系列 原生彩色激光雷达正式落地
[转帖]us/os就绪表的维护算法分析
携手ADI赢得未来
有关指纹算法
高阶智驾要落地,线控底盘为什么必须执行得准
简单实用的单片机CRC 快速算法
ADI:传感技术助力未来自动驾驶的发展
目标跟踪算法在红外热成像跟踪技术上的应用
2035年自动驾驶出租车市场规模将达1680亿美元
实时训练驾驶人工智能
加密算法之MD5算法
特斯拉监督版FSD加入中国市场
地平线征程 6 系列集成 Cadence Tensilica Vision DSP,实现规模化量产,合作加速智能驾驶解决方案部署
无线传感器网络低功耗分簇路由算法设计
数字PID控制算法之一
PID算法
掘金自动驾驶,不要把大坑当机会
自动驾驶正推动汽车行业加速布局人形机器人
自动驾驶的现状与未来(节选)
基于LPC2138的血压测量算法开发平台电路图
面向算法硬件加速的FPGA实现方法
求FSK信号的解调算法,主要是铁路上的移频信号!
CRC算法原理及C语言实现
76-81GHz自动驾驶CMOS RADAR
加快实现自动驾驶(完整小组讨论)
采用Mean-Shift和Camshift算法相结合的火焰视频图像跟踪设计
数字PID控制及其改进算法的应用
曲面显示屏取代传统汽车挡风玻璃
vxwokrs下静态图像压缩算法(上)
计算机科学与技术反思录(2)