热文 | 卷积神经网络入门案例,轻松实现花朵分类(3)
正则化
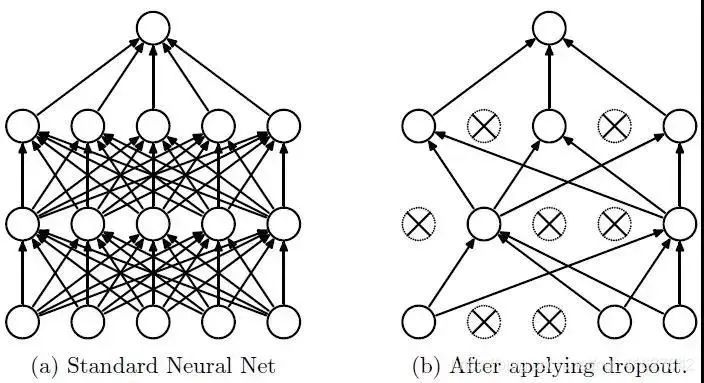
正则化的方法有多种,这里使用 Dropout 应用到网络层中,它会随机将一部分神经元的激活值停止工作,在训练过程中从该层中暂时退出,从而不对输出产生影响;后续训练先恢复之前被停止工作的神经元,再随机将一部分神经元停止工作,再训练。
这样使模型不会太依赖某些局部的特征,泛化性更强。a图全连接结构的模型。b图是在a网络结构基础上,使用 Dropout后,随机将一部分神经元的暂时停止工作。
训练流程:
首先随机(临时)删除网络中一些的隐藏层神经元(退出此次训练),输入输出神经元保存不变。
然后把输入x通过修改后的网络前向传播,得到的损失结果通过修改后的网络反向传播;一批训练样本执行完这个过程后,在没有被删除的神经元上按照梯度下降法更新对应的参数(w, b)。
最后重复1、2步过程。恢复被删掉的神经元,此时被删除的神经元保持原样,而没有被删除的神经元已经更新相关参数。
参考:Dropout(正则化)
Dropout 以一小部分数字作为其输入值,形式为 0.1、0.2、0.4 等。使得此层的10%、20%、40%的神经元被暂时停止工作。
下面使用:layers.Dropout(0.2)
model = Sequential([
  data_augmentation,
  layers.experimental.preprocessing.Rescaling(1./255),
  layers.Conv2D(16, 3, padding='same', activation='relu'),
  layers.MaxPooling2D(),
  layers.Conv2D(32, 3, padding='same', activation='relu'),
  layers.MaxPooling2D(),
  layers.Conv2D(64, 3, padding='same', activation='relu'),
  layers.MaxPooling2D(),
  layers.Dropout(0.2),
  layers.Flatten(),
  layers.Dense(128, activation='relu'),
  layers.Dense(num_classes)
])
重新编译和训练模型
# 编译模型
model.compile(optimizer='adam',
              loss=tf.keras.losses.SparseCategoricalCrossentropy(from_logits=True),
              metrics=['accuracy'])
# 查看网络结构
model.summary()
# 训练模型
epochs = 15
history = model.fit(
  train_ds,
  validation_data=val_ds,
  epochs=epochs
)
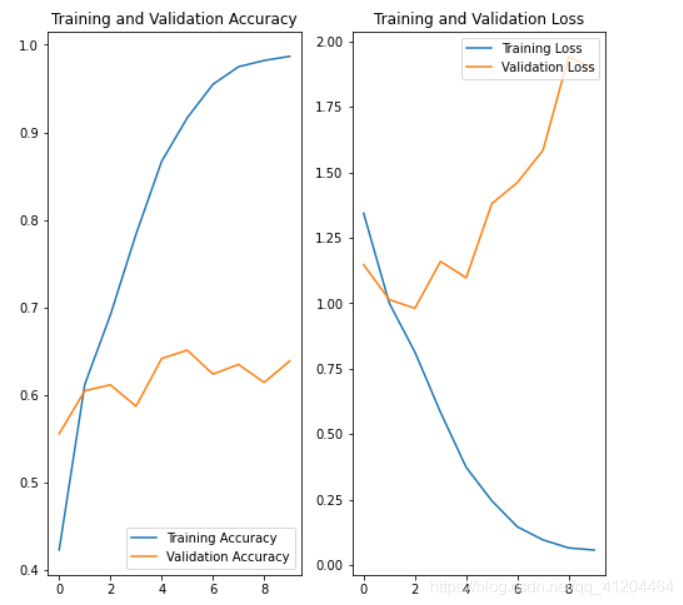
在训练和验证集上查看损失值和准确性:
acc = history.history['accuracy']
val_acc = history.history['val_accuracy']
loss = history.history['loss']
val_loss = history.history['val_loss']
epochs_range = range(epochs)
plt.figure(figsize=(8, 8))
plt.subplot(1, 2, 1)
plt.plot(epochs_range, acc, label='Training Accuracy')
plt.plot(epochs_range, val_acc, label='Validation Accuracy')
plt.legend(loc='lower right')
plt.title('Training and Validation Accuracy')
plt.subplot(1, 2, 2)
plt.plot(epochs_range, loss, label='Training Loss')
plt.plot(epochs_range, val_loss, label='Validation Loss')
plt.legend(loc='upper right')
plt.title('Training and Validation Loss')
plt.show()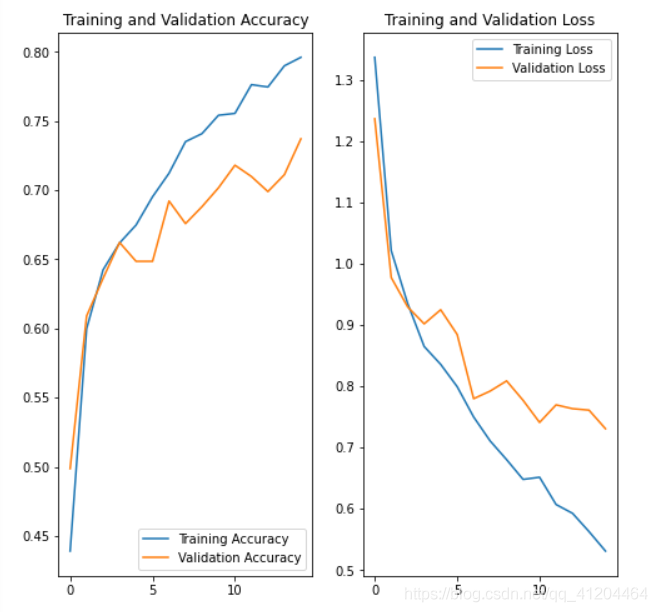
对比之前模型的效果,差别还是挺大的;使用数据增强、正则化后的模型,降低了过拟合的影响;验证集的损失和模型准确度,与训练集更接近了。
预测新数据
# 预测新数据 下载一张新图片,来预测它属于什么类型花朵
sunflower_url = "https://storage.googleapis.com/download.tensorflow.org/example_images/592px-Red_sunflower.jpg"
sunflower_path = tf.keras.utils.get_file('Red_sunflower', origin=sunflower_url)
img = keras.preprocessing.image.load_img(
    sunflower_path, target_size=(img_height, img_width)
)
img_array = keras.preprocessing.image.img_to_array(img)
img_array = tf.expand_dims(img_array, 0) # Create a batch
predictions = model.predict(img_array)
score = tf.nn.softmax(predictions[0])
print(
    "该图像最有可能属于{},置信度为 {:.2f}%"
    .format(class_names[n
p.argmax(score)], 100 * np.max(score)) )
该图像最有可能属于sunflowers,置信度为 97.38%
完整代码
'''
环境:Tensorflow2  Python3.x
'''
import matplotlib.pyplot as plt
import numpy as np
import os
import PIL
import tensorflow as tf
from tensorflow import keras
from tensorflow.keras import layers
from tensorflow.keras.models import Sequential
# 下载数据集
import pathlib
dataset_url = "https://storage.googleapis.com/download.tensorflow.org/example_images/flower_photos.tgz"
data_dir = tf.keras.utils.get_file('flower_photos', origin=dataset_url, untar=True)
data_dir = pathlib.Path(data_dir)
# 查看数据集图片的总数量
image_count = len(list(data_dir.glob('*/*.jpg')))
print(image_count)
# 查看郁金香tulips目录下的第1张图片;
tulips = list(data_dir.glob('tulips/*'))
PIL.Image.open(str(tulips[0]))
# 定义加载图片的一些参数,包括:批量大小、图像高度、图像宽度
batch_size = 32
img_height = 180
img_width = 180
# 将80%的图像用于训练
train_ds = tf.keras.preprocessing.image_dataset_from_directory(
  data_dir,
  validation_split=0.2,
  subset="training",
  seed=123,
  image_size=(img_height, img_width),
  batch_size=batch_size)
# 将20%的图像用于验证
val_ds = tf.keras.preprocessing.image_dataset_from_directory(
  data_dir,
  validation_split=0.2,
  subset="validation",
  seed=123,
  image_size=(img_height, img_width),
  batch_size=batch_size)
# 打印数据集中花朵的类别名称,字母顺序对应于目录名称
class_names = train_ds.class_names
print(class_names)
# 将像素的值标准化至0到1的区间内。
normalization_layer = layers.experimental.preprocessing.Rescaling(1./255)
# 调用map将其应用于数据集:
normalized_ds = train_ds.map(lambda x, y: (normalization_layer(x), y))
image_batch, labels_batch = next(iter(normalized_ds))
first_image = image_batch[0]
# Notice the pixels values are now in `[0,1]`.
print(np.min(first_image), np.max(first_image))
# 数据增强 通过对已有的训练集图片 随机转换(反转、旋转、缩放等),来生成其它训练数据
data_augmentation = keras.Sequential(
  [
    layers.experimental.preprocessing.RandomFlip("horizontal",
                                                 input_shape=(img_height,
                                                              img_width,
                                                              3)),
    layers.experimental.preprocessing.RandomRotation(0.1),
    layers.experimental.preprocessing.RandomZoom(0.1),
  ]
)
# 搭建 网络模型
model = Sequential([
  data_augmentation,
  layers.experimental.preprocessing.Rescaling(1./255),
  layers.Conv2D(16, 3, padding='same', activation='relu'),
  layers.MaxPooling2D(),
  layers.Conv2D(32, 3, padding='same', activation='relu'),
  layers.MaxPooling2D(),
  layers.Conv2D(64, 3, padding='same', activation='relu'),
  layers.MaxPooling2D(),
  layers.Dropout(0.2),
  layers.Flatten(),
  layers.Dense(128, activation='relu'),
  layers.Dense(num_classes)
])
# 编译模型
model.compile(optimizer='adam',
              loss=tf.keras.losses.SparseCategoricalCrossentropy(from_logits=True),
              metrics=['accuracy'])
# 查看网络结构
model.summary()
# 训练模型
epochs = 15
history = model.fit(
  train_ds,
  validation_data=val_ds,
  epochs=epochs
)
# 在训练和验证集上查看损失值和准确性
acc = history.history['accuracy']
val_acc = history.history['val_accuracy']
loss = history.history['loss']
val_loss = history.history['val_loss']
epochs_range = range(epochs)
plt.figure(figsize=(8, 8))
plt.subplot(1, 2, 1)
plt.plot(epochs_range, acc, label='Training Accuracy')
plt.plot(epochs_range, val_acc, label='Validation Accuracy')
plt.legend(loc='lower right')
plt.title('Training and Validation Accuracy')
plt.subplot(1, 2, 2)
plt.plot(epochs_range, loss, label='Training Loss')
plt.plot(epochs_range, val_loss, label='Validation Loss')
plt.legend(loc='upper right')
plt.title('Training and Validation Loss')
plt.show()
作者简介:黎国溥,华为云-云享专家、CSDN博客专家、华为云-云创·首席贡献官、华为云-年度社区风云人物
参考链接:
https://colab.research.google.com/github/tensorflow/docs/blob/master/site/en/tutorials/images/classification.ipynb#scrollTo=L1WtoaOHVrVh
原文链接:
https://blog.csdn.net/qq_41204464/article/details/116567051
*博客内容为网友个人发布,仅代表博主个人观点,如有侵权请联系工作人员删除。


