选择最佳测试音和测试设备的成功高速ADC正弦波

ALSO SEE:
- Application Note: Coherent Sampling Calculator (CSC)
- Coherent Sampling Calculator (XLS, 81K)
In sinewave-testing a high-speed analog-to-digital converter (ADC), it is not only imperative to sample the applied waveform continuously to avoid unwanted artifacts in the FFT spectrum, but to precisely select the sampling frequency (fSAMPLE), the input test tone (fIN), and the size of the data record (NRECORD). For any given clock frequency there exist certain input test tones, which can hide ADC errors, while other frequencies reveal ADC errors. These frequencies can vary by only a fraction of a percent and yield vastly different results. The optimum input test tone is one for, which there are NRECORD distinct phases sampled, which are uniformly distributed between 0 and 2π radians. Taking this knowledge into account, coherent sampling can be described as the sampling of a periodic signal, where an integer number of its cycles fit into a predefined sampling window. Mathematically, this is expressed by
fIN = (NWINDOW / NRECORD) × fSAMPLE,
where fIN is a continuous sinusoidal input signal, fSAMPLE is the ADC's clock/sample frequency, NWINDOW represents an integer number of cycles within the sampling window, and NRECORD is the number of data points targeted for the sampling window or FFT.
Additionally it is important to choose NRECORD large enough to produce at least one representative sample of every frequency bin² of the converter. Given that the input tone is chosen as previously discussed, an ideal converter's transfer curve (excluding random noise) requires the minimum value for NRECORD to be π2N, where N is the resolution of the data converter under test.
There are two common ways to calculate the desired input tone. Following are examples of these two methods based on coherent sampling. Assuming that an ADC, such as the MAX1190, is driven with a 120MHz clock, and a near optimum input frequency of 17MHz is to be analyzed with an 8192-point FFT record, the following two steps provide guidance in selecting the appropriate input test tone.
- Start with fIN = 17MHz and fSAMPLE = 120MHz to determine the window size NWINDOW (remember that according to the previous discussion, NWINDOW has to be an integer odd or mutually prime number) for an 8192-point data record NRECORD.
NWINDOW = int (fIN / fSAMPLE) × NRECORD
NWINDOW = int (17MHz / 120MHz) × 8192 = 1160 - Based on the above result for NWINDOW, the next closest mutually prime (odd) number is 1163 (1161). Use either of these numbers to compute the final, near-optimum input test tone as follows
fIN = fSAMPLE × (NWINDOW / NRECORD)
fIN(MUTUALLY_PRIME) = 120MHz × (1163 / 8192) = 17.0361328MHz
fIN(ODD) = 120MHz × (1161 / 8192) = 17.0068359MHz
- Determine the resolution of the sampling frequency that fits into an 8192-point record by
Δf = fSAMPLE / NRECORD
Δf = 120MHz / 8192 = 14.6484375kHz - Some of commonly available signal generators in the market may not offer enough resolution to offer this many digits to accurately capture both input and sampling frequency. To bypass this requirement and still meet the coherent sampling condition, it is recommended to select Δf based on the next highest integer number.
Δf = int (fSAMPLE / NRECORD) = 15kHz - Based on the new Δf, the exact sampling frequency computes to
fSAMPLE = Δf × NRECORD
fSAMPLE = 15kHz × 8192 = 122.880MHz - Δf also helps to determine the size of NWINDOW. Again, use the next highest integer odd (or mutually prime) number, determined by the desired input test tone and Δf.
NWINDOW = int (fIN / Δf)
NWINDOW = 17MHz / 15kHz = 1133 - Based on these findings, the near optimum input test tone fIN calculates as follows
fIN = fSAMPLE × (NWINDOW / NRECORD)
fIN = 122.88MHz (1133 / 8192) = 16.995MHz
Equipment and Set-Up Recommendations for a Successful High-Speed ADC Test
Table 1 lists some recommended hardware instruments and software products, which have proven to be quite valuable for data capture and analysis of high-speed ADC dynamic performance parameters.Table 1. Equipment and software tool recommendations for high-speed ADC testing
Type Of Equipment | Equipment Count and Notes |
| Synthesized Signal Generator: HP/Agilent 8662/3A (10kHz to 1.28/2.56GHz, -139dBm to +13dBm) or HP/Agilent 8644A (252kHz to 1.030GHz, -140dBm to +20dBm) | 2 generators for single-channel ADC input and clock 3 generators for IMD test (single-channel ADC) or 3 generators for dual-channel ADC inputs and clock 4 generators for IMD test (dual-channel ADC) |
| Logic Analyzer System: HP/Agilent 16500C mainframe (or similar) (1Gsps State Analyzer Card HP16517A optional and for ADCs with sampling speeds >100MHz only) | 1 Logic analyzer (in default configuration, allows to evaluate up to 4 channels for ADCs with up to 16-bit resolution) |
| Band-Pass Filters: TTE's Q56/KC7 series for frequencies 100MHz/>100MHz (Other suitable filter suppliers are Allen Avionics or KL Microwave) | 1 Filter for single-channel ADC 2 Filters for simultaneous evaluation of a dual-channel ADC |
| Power Combiner: Mini-Circuits 15542 ZSC-2-1W (or similar) | 1 Combiner (used for two-tone IMD evaluation only) |
| RF FrequencyBalun/Transformer: MA/COM H-9-SMA (or similar) | 2 Baluns for single-channel ADC and clock 3 Baluns for dual-channel ADC and clock |
| GPIB-Compatible Interface Card: National Instruments GPIB/IEEE®-488 Interface Card + driver and installation software (PC-/PCMCIA-card or GPIB-to-USB port adapter) | 1 Interface card Note: This card is recommended for fast data transfer between logic analyzer and computer; requires C-based software platform (e.g. LabWindows/CVI) to control the interface. Data can also be extracted from the logic analyzer with a floppy disk. |
| Data Analysis Software: MATLAB from The Math Works Inc. or Measurement Studio with LabWindows/CVI from National Instruments | 1 License for each software package Note: LabWindows/CVI provides a C-based platform to control the interface between logic analyzer and PC |
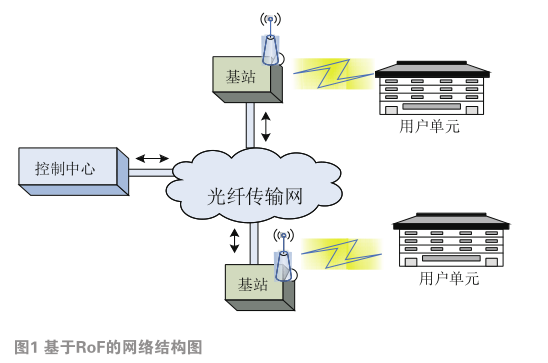
Probably the most critical elements in such a test setup (Figure 1) are the synthesized signal generators, used to generate the waveforms for the clock and input frequencies. Suitable signal generators must feature low phase noise; because measured dynamic parameters such as SNR will degrade dramatically with an increase in phase noise "Defining and Testing Dynamic Parameters in High-Speed ADCs, Part 1". Furthermore, these signal synthesizers have to provide adequate output power, must have phase locking capabilities, and a frequency resolution of 0.1Hz or better to ensure accurate coherence.
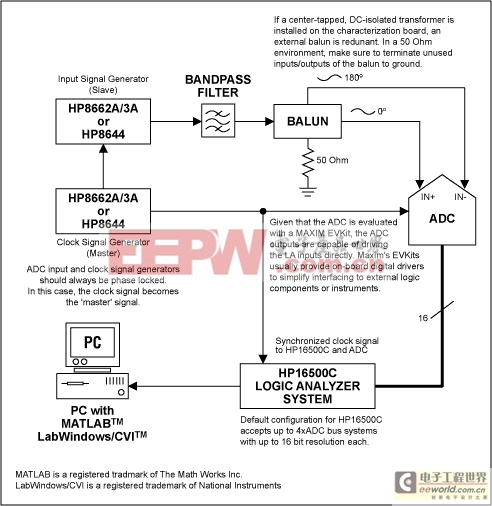
Figure 1.
Although generators such as the HP8662A series from Hewlett-Packard/Agilent are rather expensive and have a limited output amplitude range of -139dBm to +13dBm (0.025µVRMS to 1VRMS into a 50Ω load), they satisfy all other test requirements and are most suitable for the dynamic tests of high-speed converters.
To further reduce the harmonic distortion components of the synthesizer's output frequency it is recommended to filter the desired test tone by applying a high-quality bandpass between generator and ADC input drive.
Clock and signal inputs of fast ADCs usually are equipped with true differential input architectures, which require the signal generator's single-ended output to be converted to a differential signal. This can be achieved by using an external balun or an off-the-shelf transformer with center tap and DC isolation. Usually, the latter is a surface-mount component and should be incorporated on the characterization board, used to test the ADC. Most of Maxim's high-speed data converter evaluation kits feature such transformers and emphasize on impedance matched I/O lines to keep unwanted signal skew and phase mismatch at a minimum.
To capture digital data on the parallel output ports of a high-speed ADC a fast Logic Analyzer will be needed. An excellent choice is the Hewlett-Packard/Agilent HP16500 Logic Analyzer mainframe. For converter sampling/clock speeds greater than 100MHz, this system accepts high-speed data capture cards such as the HP16517A. The system's mainframe features a GPIB/HPIB bus, capable of interfacing with a PC-based GPIB to transmit data from the Logic Analyzer to a PC quickly. One may of course use the floppy drive built into the instrument to store data, however depending on the size of the data record (number of points in the FFT) this may take significantly longer than just utilizing the analyzer's GPIB interface. Once data has been sent to the PC, a signal processing software such as MATLAB may be used to analyze the data records from the logic analyzer. The following MATLAB sample code maybe used to calculate the basic AC specifications of any a high-speed ADC.
%Source Code Sample MAX144X Family | ||||
| %The following program code plots the FFT spectrum of a desired test tone. Test tone based on coherent sampling criteria, and | ||||
| %computes SNR, SINAD, THD and SFDR. | ||||
| %Copyright Au/Hofner, Maxim Integrated Products, 120 San Gabriel Drive, Sunnyvale, CA94086 | ||||
| %This program is believed to be accurate and reliable. This program may get altered without prior notification.; | ||||
| disp('HP16500C LA 100/110 State Card'); | ||||
| filename=input('Enter file name or press RETURN to accept data from LA via GPIB/HPIB): '); | ||||
| if isempty(filename) | ||||
| filename = 'listing'; | ||||
| end | ||||
| fid=fopen(filename,'r'); | ||||
| numpt=input('Number of Points in FFT? '); | ||||
| fclk=input('Sampling Frequency (MHz)? '); | ||||
| numbit=input('ADC Resolution? '); | ||||
| %Discard first 13 lines of the LA listing (LA header), as they don't contain valid data. | ||||
| for i=1:13, | ||||
| fgetl(fid); | ||||
| end | ||||
| [v1,count]=fscanf(fid,'%f',[2,numpt]); | ||||
| fclose(fid); | ||||
| v1=v1'; | ||||
| code=v1(:,2); | ||||
| %Warning: ADC output may be clipping - reduce input amplitude | ||||
| if (max(code)==2numbit-1) | (min(code)==0) | ||||
| disp('WARNING: ADC OUTPUT MAYBE CLIPPING - CHECK INPUT AMPLITUDE!'); | ||||
| end | ||||
| figure; | ||||
| plot([1:numpt],code); | ||||
| title('TIME DOMAIN') | ||||
| xlabel('SAMPLES'); | ||||
| ylabel('DIGITAL OUTPUT CODE'); | ||||
| Dout=code-(2^numbit-1)/2; | %Re-center the digitized sinusoidal input | |||
| Doutw=Dout; | ||||
| Dout_spect=fft(Doutw); | ||||
| Dout_dB=20×log10(abs(Dout_spect)); | ||||
| figure; | ||||
| maxdB=max(Dout_dB(1:numpt/2)); | ||||
| plot([0:numpt/2-1].×fclk/numpt,Dout_dB(1:numpt/2)-maxdB); | ||||
| grid on; | ||||
| title('FFT PLOT'); | ||||
| xlabel('ANALOG INPUT FREQUENCY (MHz)'); | ||||
| ylabel('AMPLITUDE (dB)'); | ||||
| a1=axis; axis([a1(1) a1(2) -100 a1(4)]); | ||||
| fin=find(Dout_dB(1:numpt/2)==maxdB); | %Find the signal bin (DC represents bin=1) | |||
| span=max(round(numpt/200),5); | %Determine span of input frequency on each side | |||
| spanh=2; | %Search span for harmonic distortion components on each side | |||
| spectP=(abs(Dout_spect)).× (abs(Dout_spect)); | %Determine power level | |||
| Pdc=sum(spectP(1:span)); | %Determine DC offset power level | |||
| Ps=sum(spectP(fin-span:fin+span)); | %Determine signal power level | |||
| Fh=[]; | %Vector storing frequency and power components of signal and harmonics | |||
| Ph=[]; | %HD1=signal, HD2=2nd harmonic, HD3=3rd harmonic, etc. | |||
| %Find the harmonic frequencies/power within the FFT plot | ||||
| for har_num=1:10 | ||||
| tone=rem((har_num × (fin-1)+1)/numpt,1); | %Note: tones > fSAMPLE are aliased back | |||
| if tone>0.5 | ||||
| tone=1-tone; | ||||
| end | ||||
| Fh=[Fh tone]; | ||||
| %For this method to work properly, make sure that the folded back high order harmonics do not overlap with DC and signal | ||||
| %components or lower order harmonics. | ||||
| har_peak=max(spectP(round(tone×numpt)-spanh:round(tone×numpt)+spanh)); | ||||
| har_bin=find(spectP(round(tone×numpt)-spanh:round(tone×numpt)+spanh)==har_peak); | ||||
| har_bin=har_bin+round(tone×numpt)-spanh-1; Ph=[Ph sum(spectP(har_bin-1:har_bin+1))]; | ||||
| end | ||||
| Pd=sum(Ph(2:5)); | %Total distortion power level | |||
| Pn=sum(spectP(1:numpt/2))-Pdc-Ps-Pd; | %Extract noise power level | |||
| format; | ||||
| A=(max(code)-min(code))/2numbit | %Analog input amplitude in mV | |||
| AdB=20×log10(A) | %Analog input amplitude in dB | |||
| SNR=10×log10(Ps/Pn) | %SNR in dB | |||
| SNR=10×log10(Ps/Pn) | %SINAD in dB | |||
| SINAD=10×log10(Ps/(Pn+Pd)) | ||||
| disp('THD - HD2 through HD5'); | ||||
| THD=10×log10(Pd/Ph(1)) | %THD in dB | |||
| SFDR=10×log10(Ph(1)/max(Ph(2:10))) | %SFDR in dB | |||
| disp('SIGNAL AND HARMONIC POWER (dB)'); | ||||
| HD=10×log10(Ph(1:10)/Ph(1)) | ||||
| hold on; | ||||
| plot(Fh(2)×fclk,0,'mo',Fh(3)×fclk,0,'cx',Fh(4)×fclk,0,'r+',Fh(5)×fclk,0,'g×',Fh(6)×fclk,0,'bs',Fh(7)×fclk,0,'bd',Fh(8)×fclk,0,'kv', | ||||
| Fh(9)×fclk,0,'y^'); | ||||
| legend('SIGNAL','HD2','HD3','HD4','HD5','HD6','HD7','HD8','HD9'); | ||||
| hold off; | ||||
Conclusion
This application note provides one approach to establishing dynamic performance parameters of a high-speed ADC quickly and precisely. Digital data can also be analyzed using a high dynamic performance, high-resolution DAC in combination with an output filter and spectrum analyzer. However, that approach requires careful selection and design of the reconstruction signal path to avoid falsifying the ADCs true dynamic performance. Some applications may even prefer a test system with built-in digital distortion analyzer. Even a Logic Analyzer can deliver a quick, but rather inaccurate analysis of the digital output signals. Just remember: Choosing the appropriate configuration for your test setup entirely depends on the type of application, available hardware and software resources, design time, and the quality of dynamic performance results needed for your application.References
- Coherent Sampling vs. Window Sampling
- Defining and Testing Dynamic Parameters in High-Speed ADCs, Part 1
- Dynamic Testing of High-Speed ADCs, Part 2
- If NRECORD is a power-of-two value, then an odd number for NWINDOW will meet the coherent sampling requirement.
- The size of an ideal frequency bin is defined by bin = fSAMPLE / NRECORD.

评论